Network Device & SNMP Monitoring
Monitor your switches, routers, and firewalls alongside your servers. SNMP v1/v2c/v3 support with interface traffic, CPU, memory, and temperature metrics collected after each device is configured.
Built for teams monitoring production infrastructure
No credit card · 2-minute setup
How It Works
Step 1
Add Device
Enter the IP and SNMP credentials. Supports v1, v2c, and v3.
Step 2
Configure Metrics
Select the device metrics and interfaces you want to monitor.
Step 3
Collect Metrics
Traffic, CPU, memory, and temperature polled at 5-minute intervals.
Step 4
Alert on Issues
Workflow triggers fire on interface down, traffic spikes, or unreachable devices.
-
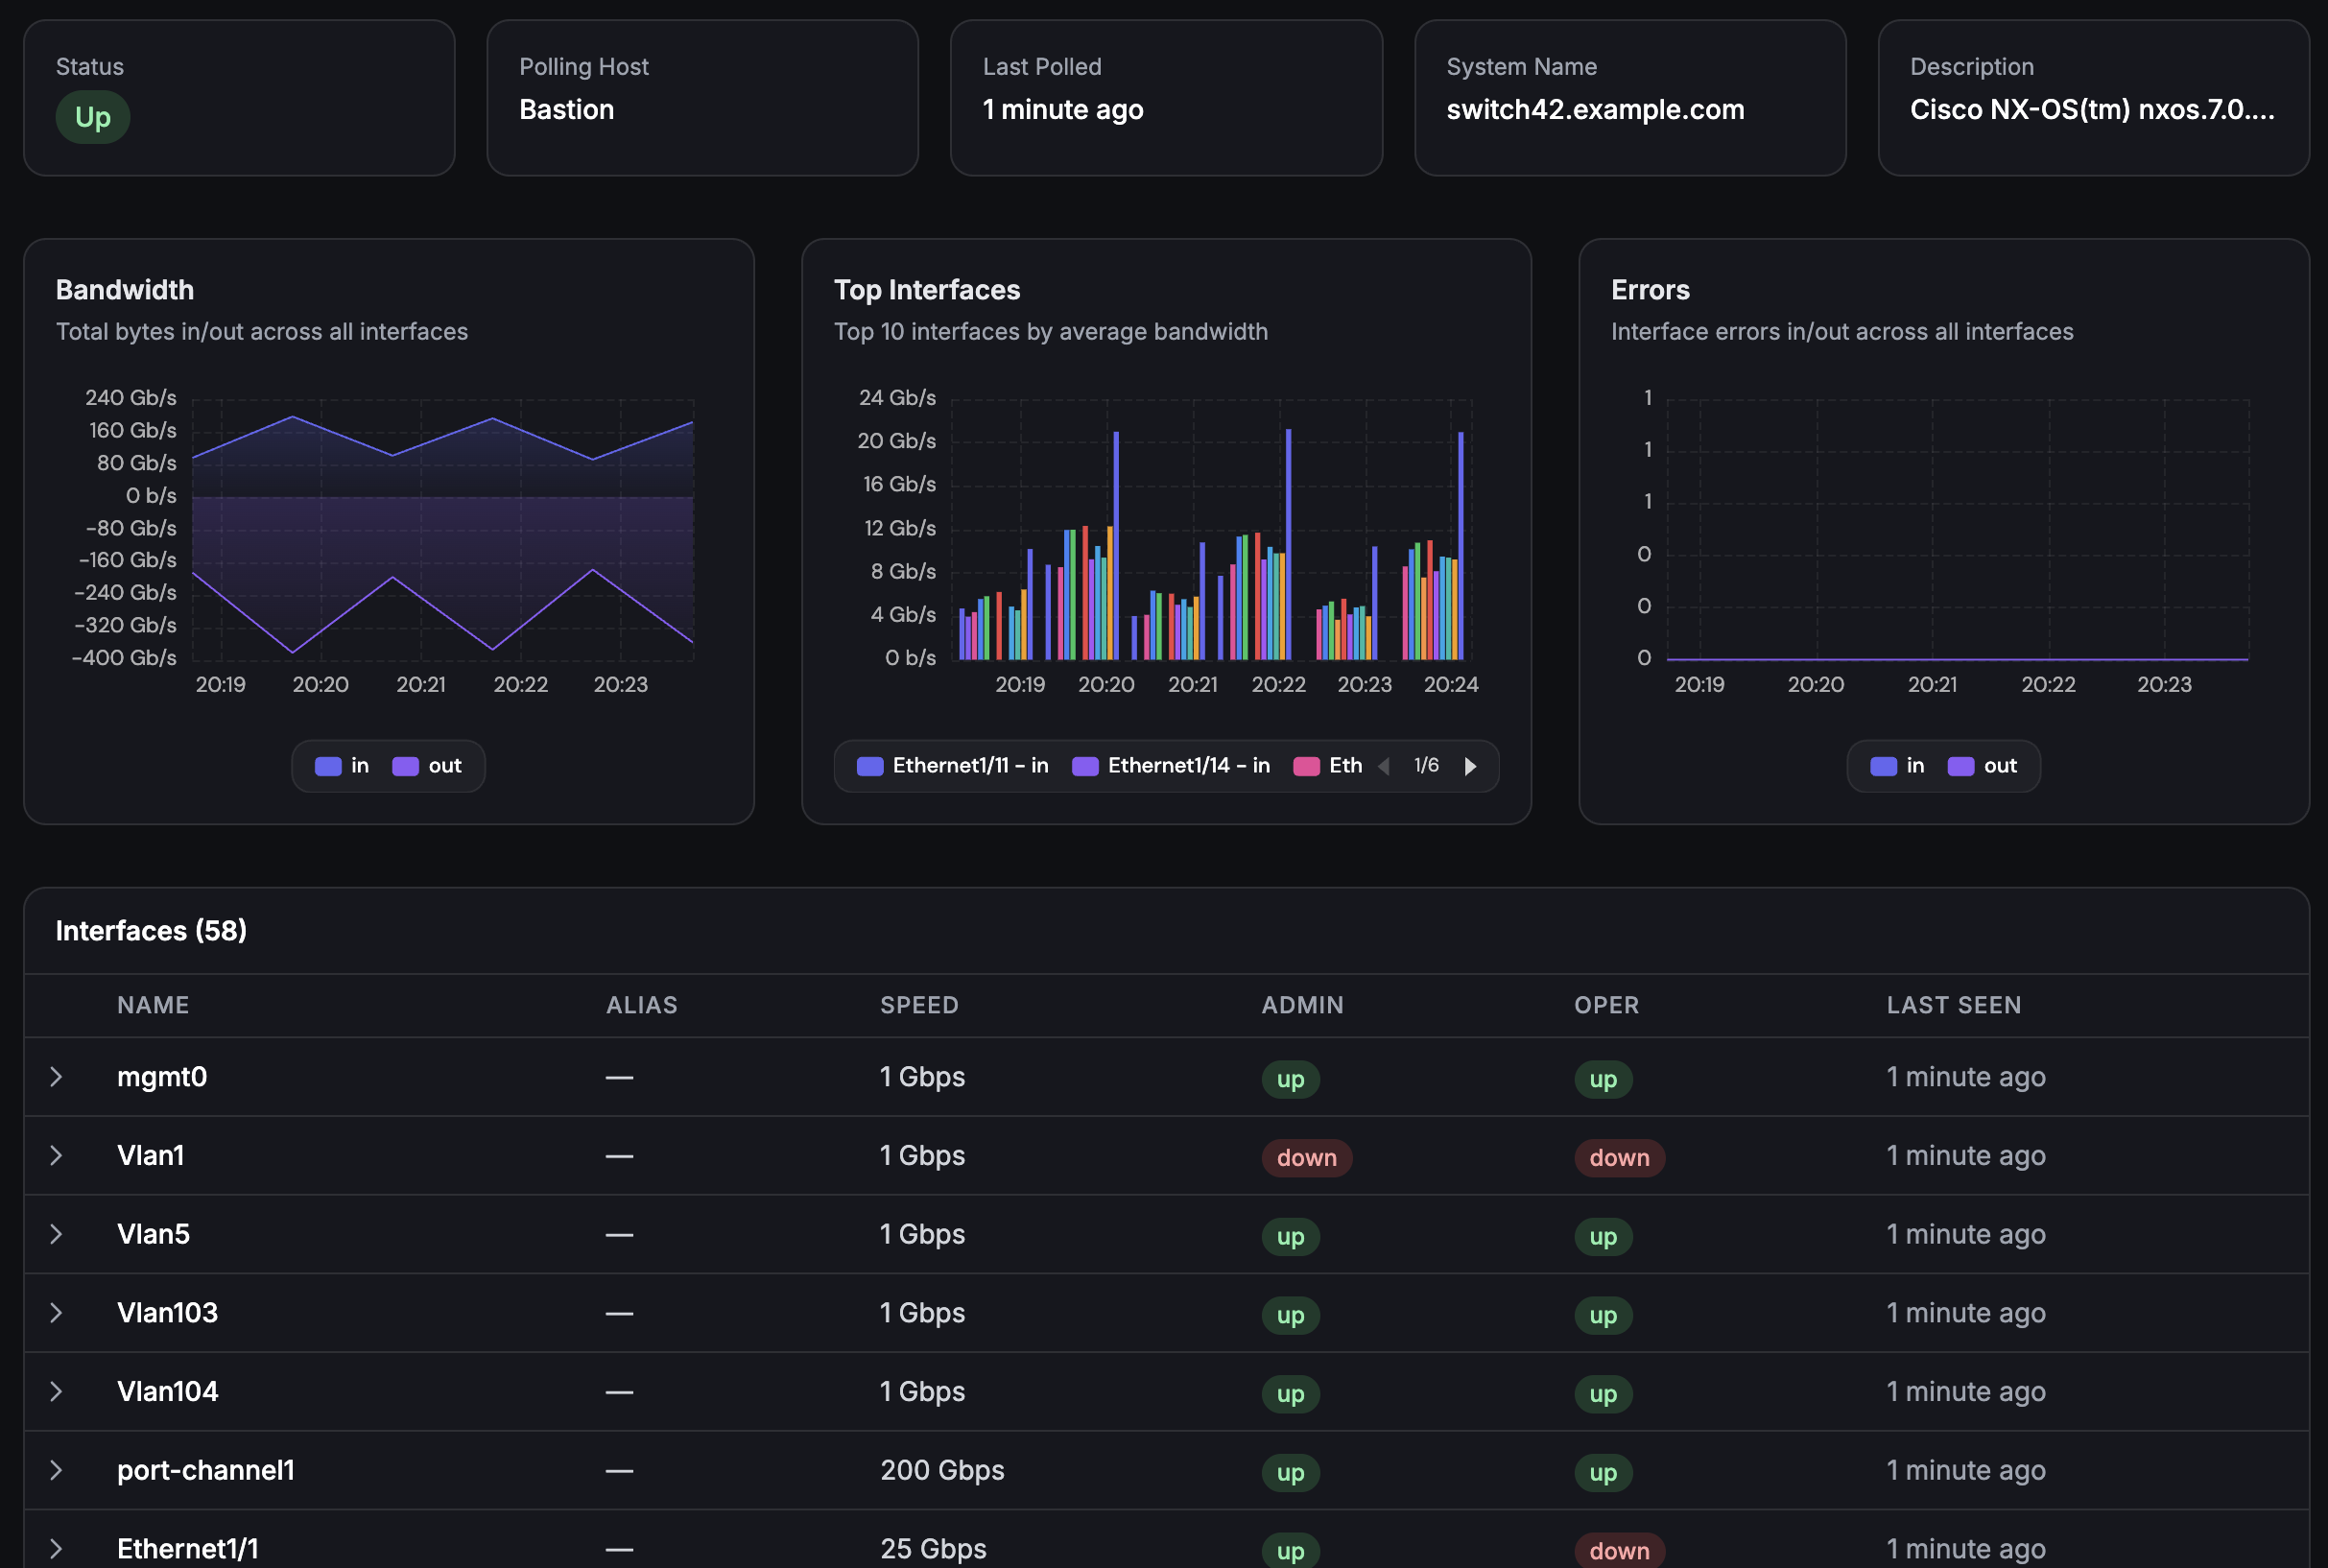
SNMP Interface Monitoring
Add a device with SNMP credentials and collect interface, sensor, and traffic metrics without maintaining a separate monitoring stack.
-
Interface Traffic at 5-Min Intervals
Track inbound and outbound bytes per interface. Spot bandwidth hogs, detect anomalies, and capacity-plan with historical traffic data.
-
Unified Server + Network View
See network device metrics alongside server metrics in the same platform. Correlate a switch port saturation with the server behind it.
Deep dive
SNMP v3 With Full Security
For environments that require encrypted monitoring, Fivenines supports SNMP v3 with SHA and MD5 authentication plus AES and DES encryption. Configure auth and priv credentials per device - no global community strings exposed on your network.
For simpler setups, v1 and v2c community strings work out of the box. Mix and match across your device fleet.
Deep dive
Alerting on Network Events
Combine SNMP monitoring with Fivenines workflows. Trigger alerts when an interface goes down, traffic exceeds a threshold, or a device becomes unreachable. Route alerts to your network team's Slack channel while server alerts go to your ops team.
Create incidents automatically when critical network events happen - with full timeline from detection to resolution.
How It Compares
| Approach | SNMP v1/v2c/v3 | Device Setup | Server Metrics | Status Pages | Cost |
|---|---|---|---|---|---|
| Manual SNMP | Manual OIDs | Free | |||
| LibreNMS | Discovery | Discovery | SNMP credentials | Self-hosted | |
| PRTG | $1,750+ | ||||
| Fivenines | Built-in | Built-in | Free |
Included on all plans
14-day free trial
Frequently Asked Questions
Which SNMP versions are supported? +
What types of network devices can I monitor? +
How often are SNMP metrics collected? +
Can I get alerts when a network device goes down? +
Does Fivenines auto-discover device capabilities? +
Explore next
Related Features
Server Alerts
Combine network device monitoring with server-level alerts for complete infrastructure coverage.
Explore ->Custom Dashboards
Build dashboards combining network device metrics with server and uptime data.
Explore ->Monitoring Workflows
Automate incident response when network devices go down or interfaces saturate.
Explore ->See how Fivenines compares to other tools
Read our guide to the best infrastructure monitoring tools in 2026.
Start monitoring your network devices in minutes
14-day trial. No credit card required.
No credit card · 2-minute setup · Cancel anytime